
Understanding Your Dashboard
Navigate the Ossprey dashboard, review scan history, and explore repository details.
The Ossprey dashboard is your central hub for monitoring software supply chain security across your repositories. This guide walks you through the key areas of the interface.
Finding your way around
The sidebar is grouped into two sections. You can collapse the whole rail to icons with the chevron on its outer edge.
Scan — the every-session working loop.
| Item | What's there |
|---|---|
| Dashboard | Metrics, activity chart, and threat-intelligence news. |
| Scan Online | Scan a single package by name, version, and ecosystem. |
| Scan Results | Every scan, filterable — see Scan history below. |
Monitor — your coverage and signal surfaces.
| Item | What's there |
|---|---|
| GitHub Integrations | Connected GitHub accounts, and the way through to repository monitoring — see GitHub Integration. |
| Artifact Caches | Packages pulled through a connected artifact cache — see Artifact Caches. |
| Threat Feed | Malware Ossprey detected across the open-source ecosystem in the last 7 days — global threat intelligence, not findings against your own scans. Filter by package name, and click through to any package's report. |
| Alerting | Destinations, rules, and alert activity — see Notifications & Alerts. |
Below those, the rail foot holds a usage meter showing your remaining scan quota and when it resets, and a Resources disclosure:
| Item | What's there |
|---|---|
| Docs | These pages (opens in a new tab). |
| Changelog | Everything we've shipped, newest first. Also reachable from the version number in the footer. |
| Roadmap | What we're building, on a timeline. You can vote for the items you want next. |
| Contact us | Opens the in-app support form. |
Account settings and API keys live in the account menu in the top-right of the top bar, alongside Log out. Data Export is reached from Account settings — see Data Export.
Every page shows a breadcrumb trail in the top bar, and there's a global search bar you can use from anywhere to find a package — and scan it, if Ossprey hasn't seen it yet. It accepts Package URL syntax, e.g. pkg:npm/[email protected] (the pkg: prefix is optional).
Older links still workSome routes were renamed as the dashboard grew.
/scan-results/now redirects to/scans/, and/asset/to/package/, both preserving your query string — so old bookmarks and shared links keep working.
Dashboard overview
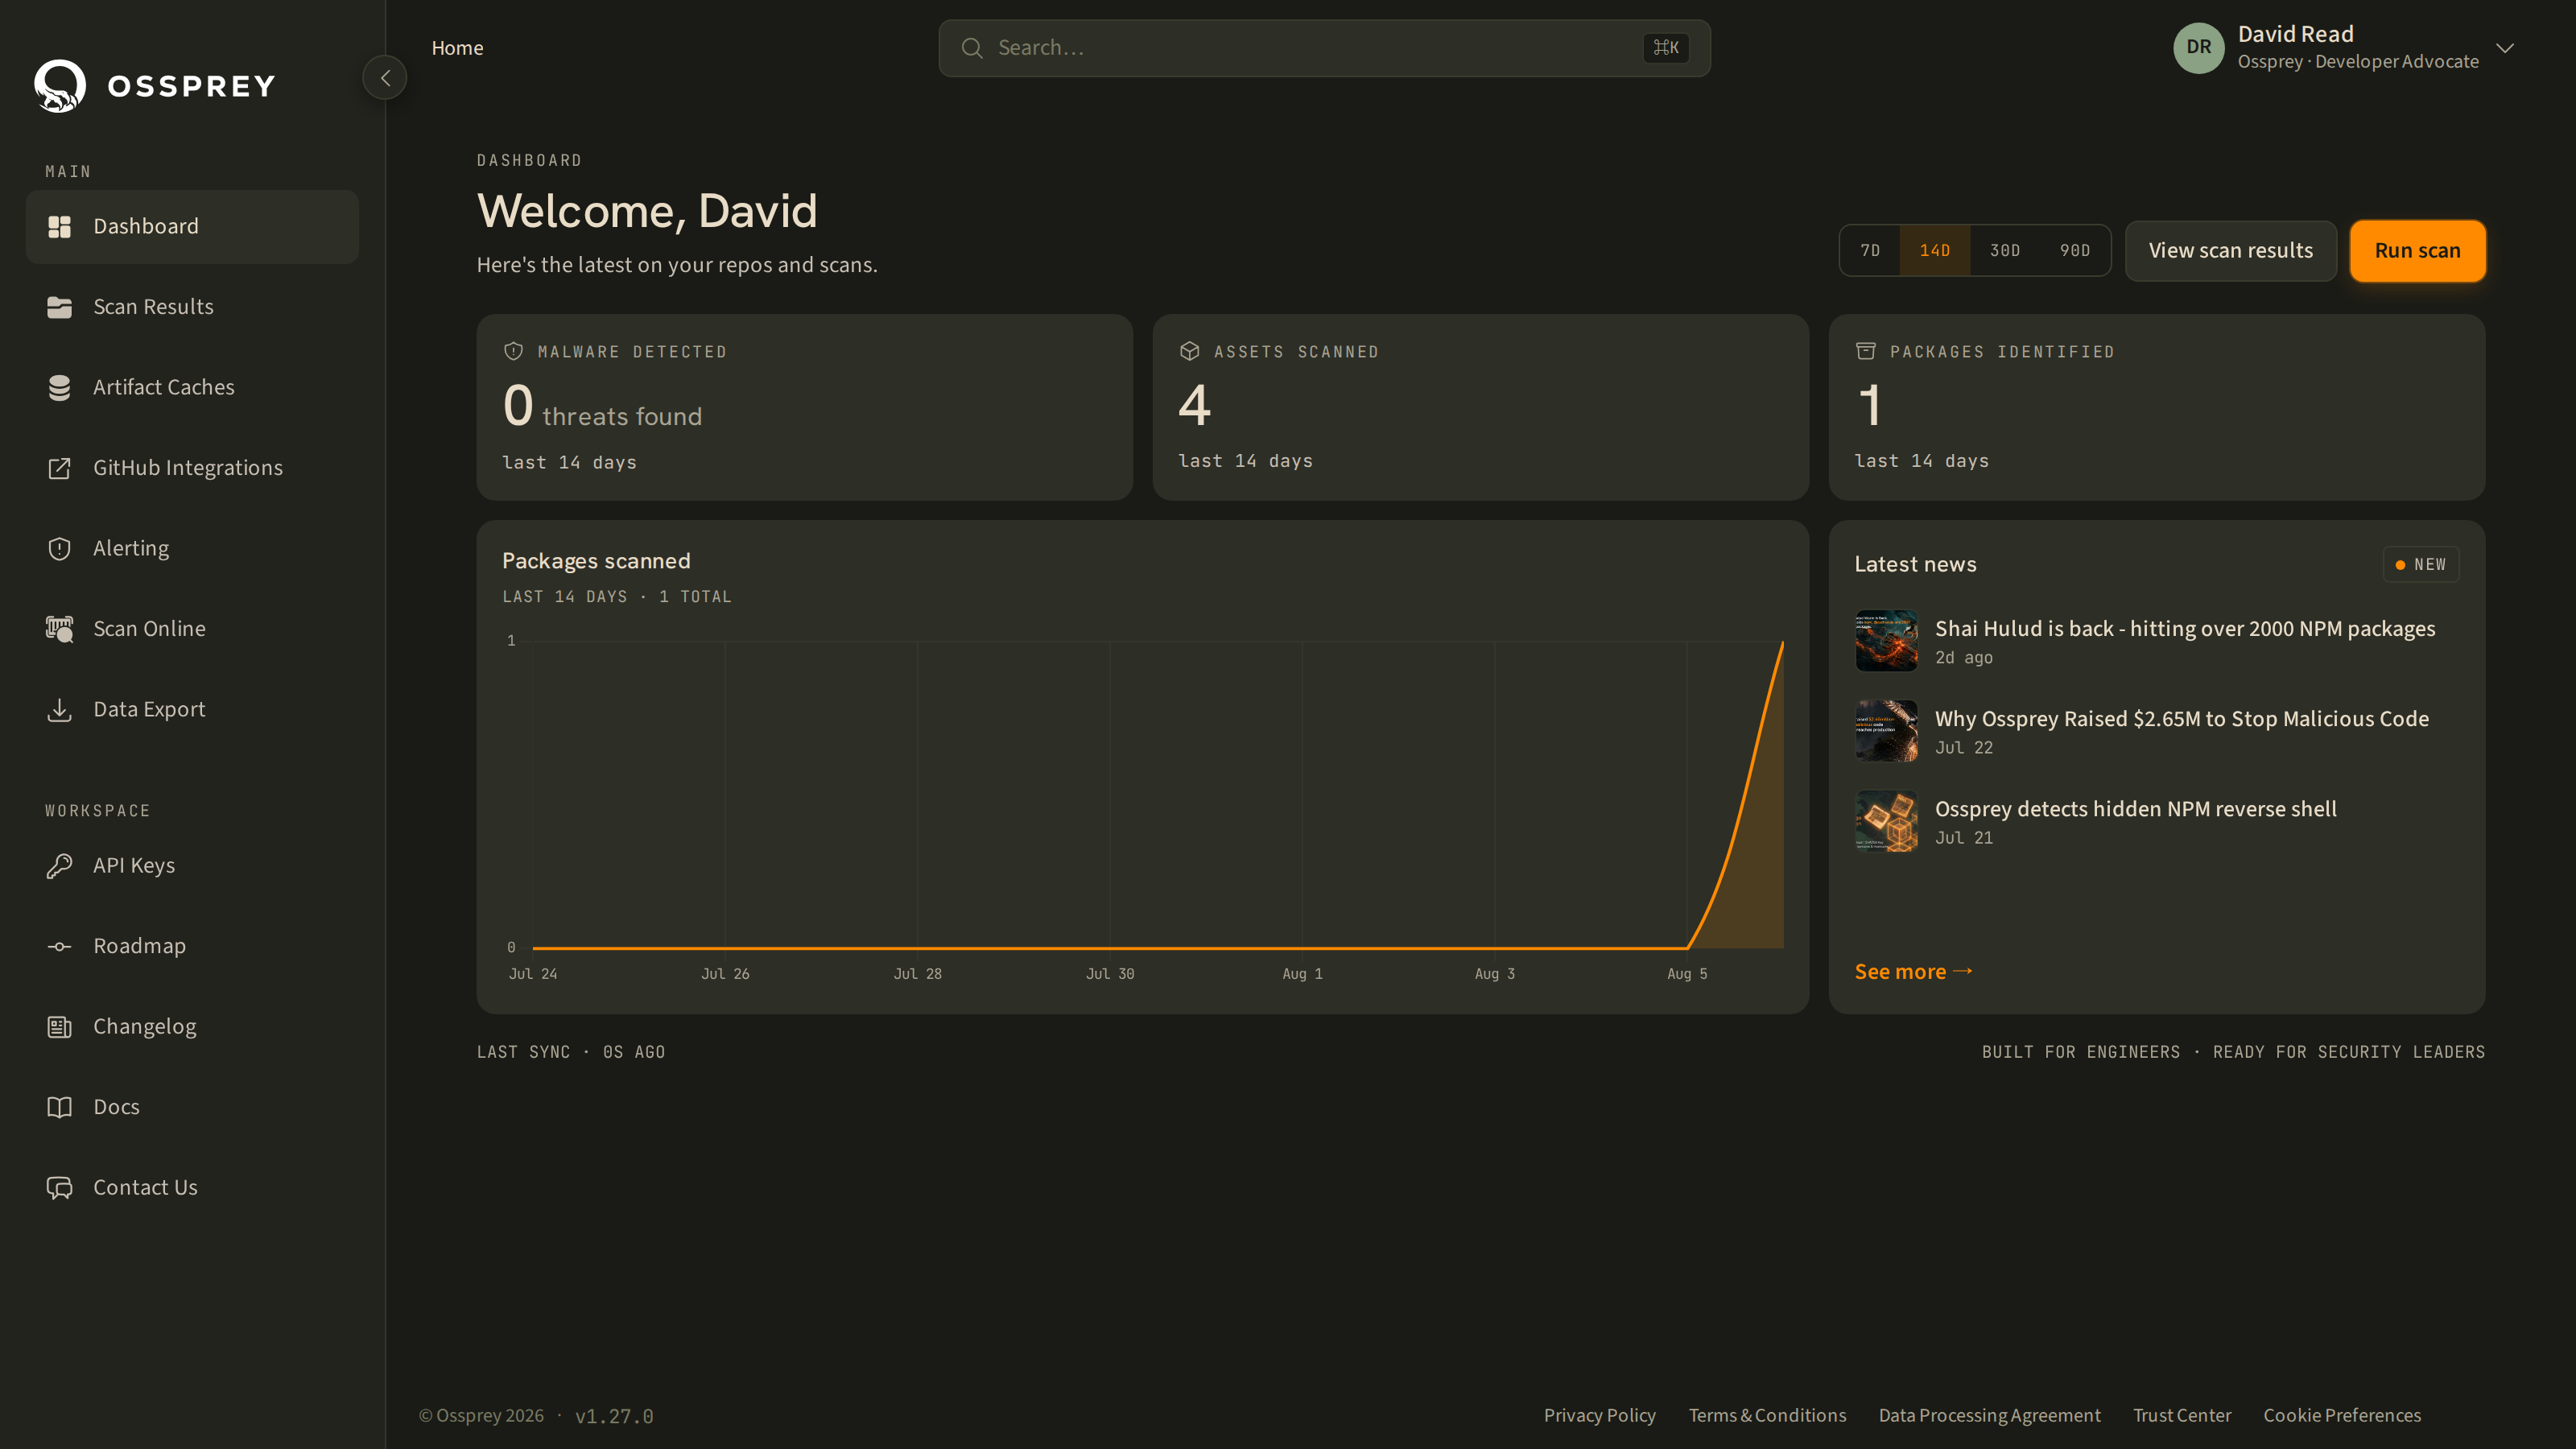
Your dashboard home page provides a quick overview of your security status across all monitored projects. At the top, you'll see three live metrics:
- Malware detected — malicious packages found. If this is greater than zero, investigate immediately.
- Assets scanned — projects and repositories you're monitoring (GitHub repos, online scans, CLI scans, artifact caches).
- Packages identified — software packages (dependencies) analysed across all your assets.
All three, and the activity chart below them, honour the time range selector in the page header — 7, 14, 30, or 90 days, defaulting to 14. The activity chart shows your scanning volume over that window, so you can see how often your projects are being scanned and when.
Beside the chart, Latest news carries current supply-chain threat intelligence.
New accounts also get a guided onboarding checklist — a floating widget that ticks itself off as you connect GitHub, run a scan, and create an API key. Dismiss it once you're set up; reopen it from the banner at any time.
The footline shows a Last sync timestamp so you know how fresh the numbers are.
Scan history
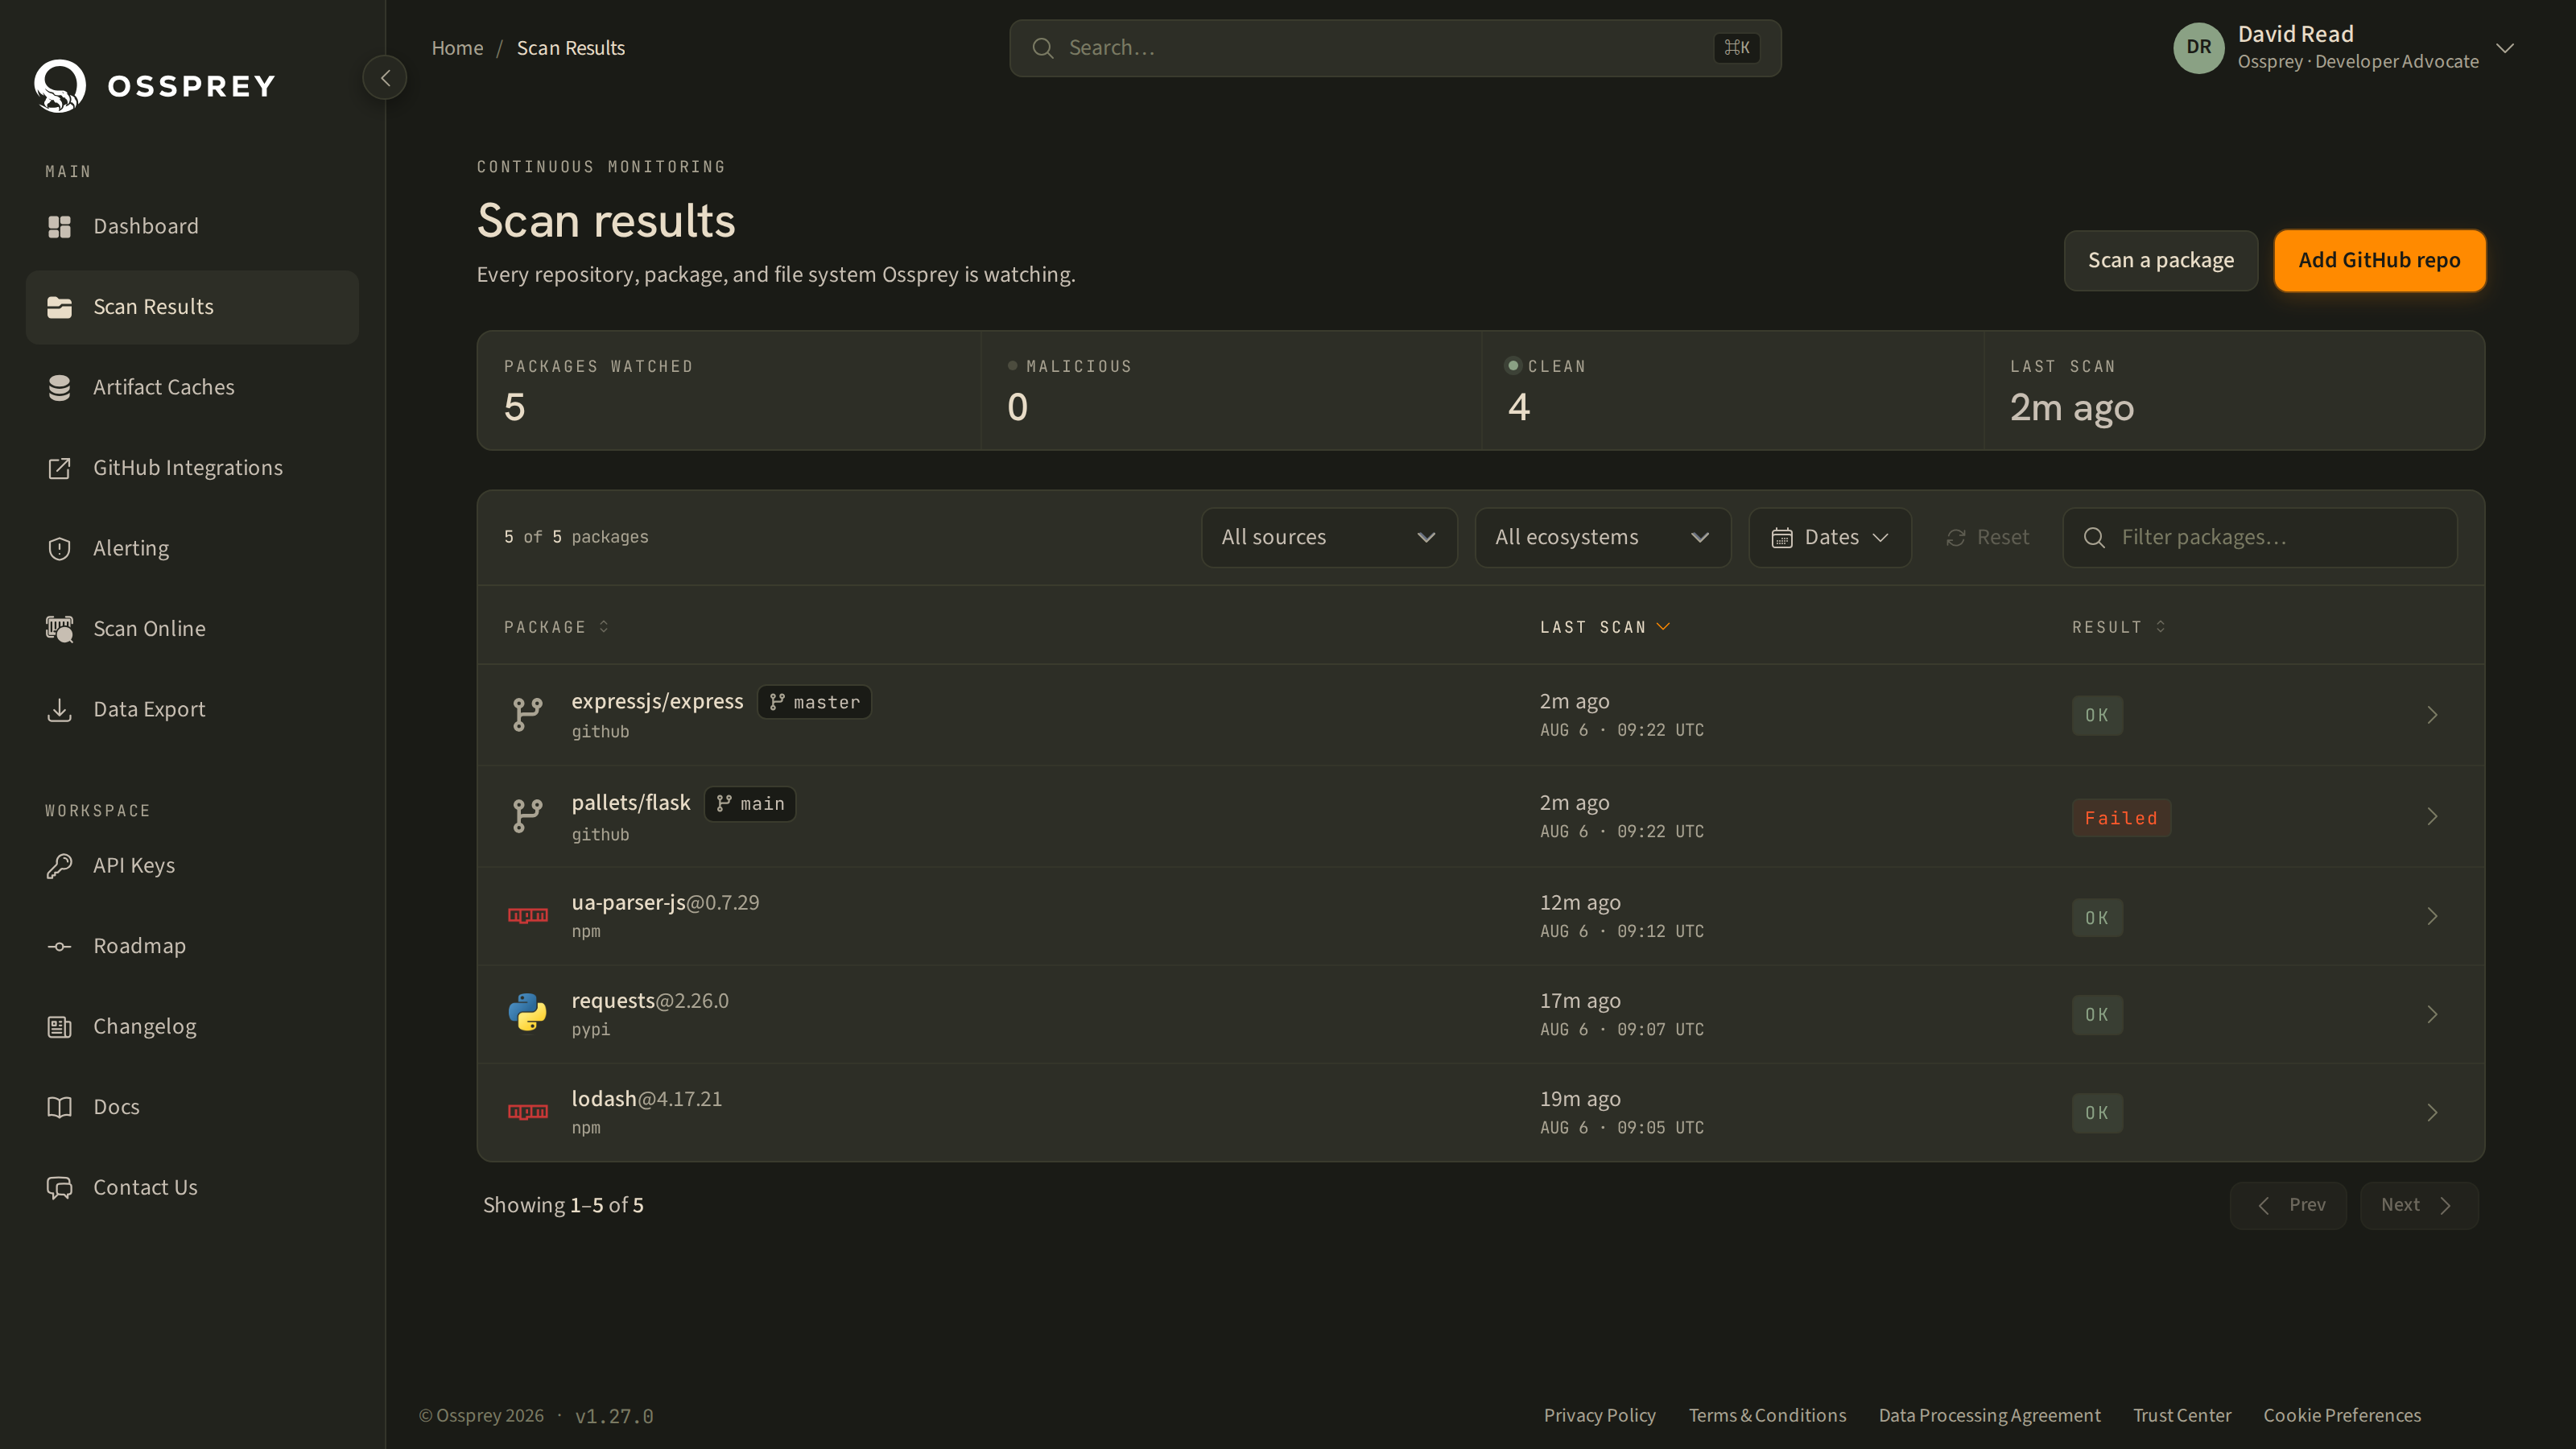
Navigate to Scan Results from the sidebar to view all your scans. You can filter by:
- Quick search — find assets by repository name, organisation, or package name
- Status — narrow to a particular scan result
- Type — filter by GitHub repositories, online scans, or other scan sources
- Ecosystem — npm or PyPI
- Date range — narrow results to a specific time period
Click Reset to clear all filters.
Each asset in the list shows its type, name, organisation, last scanned date, and result. Where an asset has more than one monitored branch, an inline branch dropdown lets you switch between them without leaving the table.
Scan results explained
| Result | Meaning |
|---|---|
| Safe | Every component was analysed and none was malicious. |
| Malicious | At least one component is malicious. Act on this — see Scan Results. |
| Scanning | The scan is queued or still running. No verdict yet. |
| Warning | Complete and clean, but a small number of components couldn't be analysed. |
| Skipped | A quarter or more of the components couldn't be analysed — usually an unsupported ecosystem, or packages not found in a registry. Treat the result as partial. |
| Not Found | Nothing in the scan could be resolved to a known package. |
| Failed | The scan errored and produced no verdict. Re-run it, or contact support if it recurs. |
Warning and Skipped matter: they tell you the scan finished but didn't see everything. Unsupported and not-found components are shown explicitly in the component list rather than silently dropped, so you can always see exactly what was and wasn't covered.
Repository overview
Repositories connected through the GitHub integration are listed on both the Scan Results page and the GitHub Monitoring page. Each shows the repository name, last scan time, and current scan result.
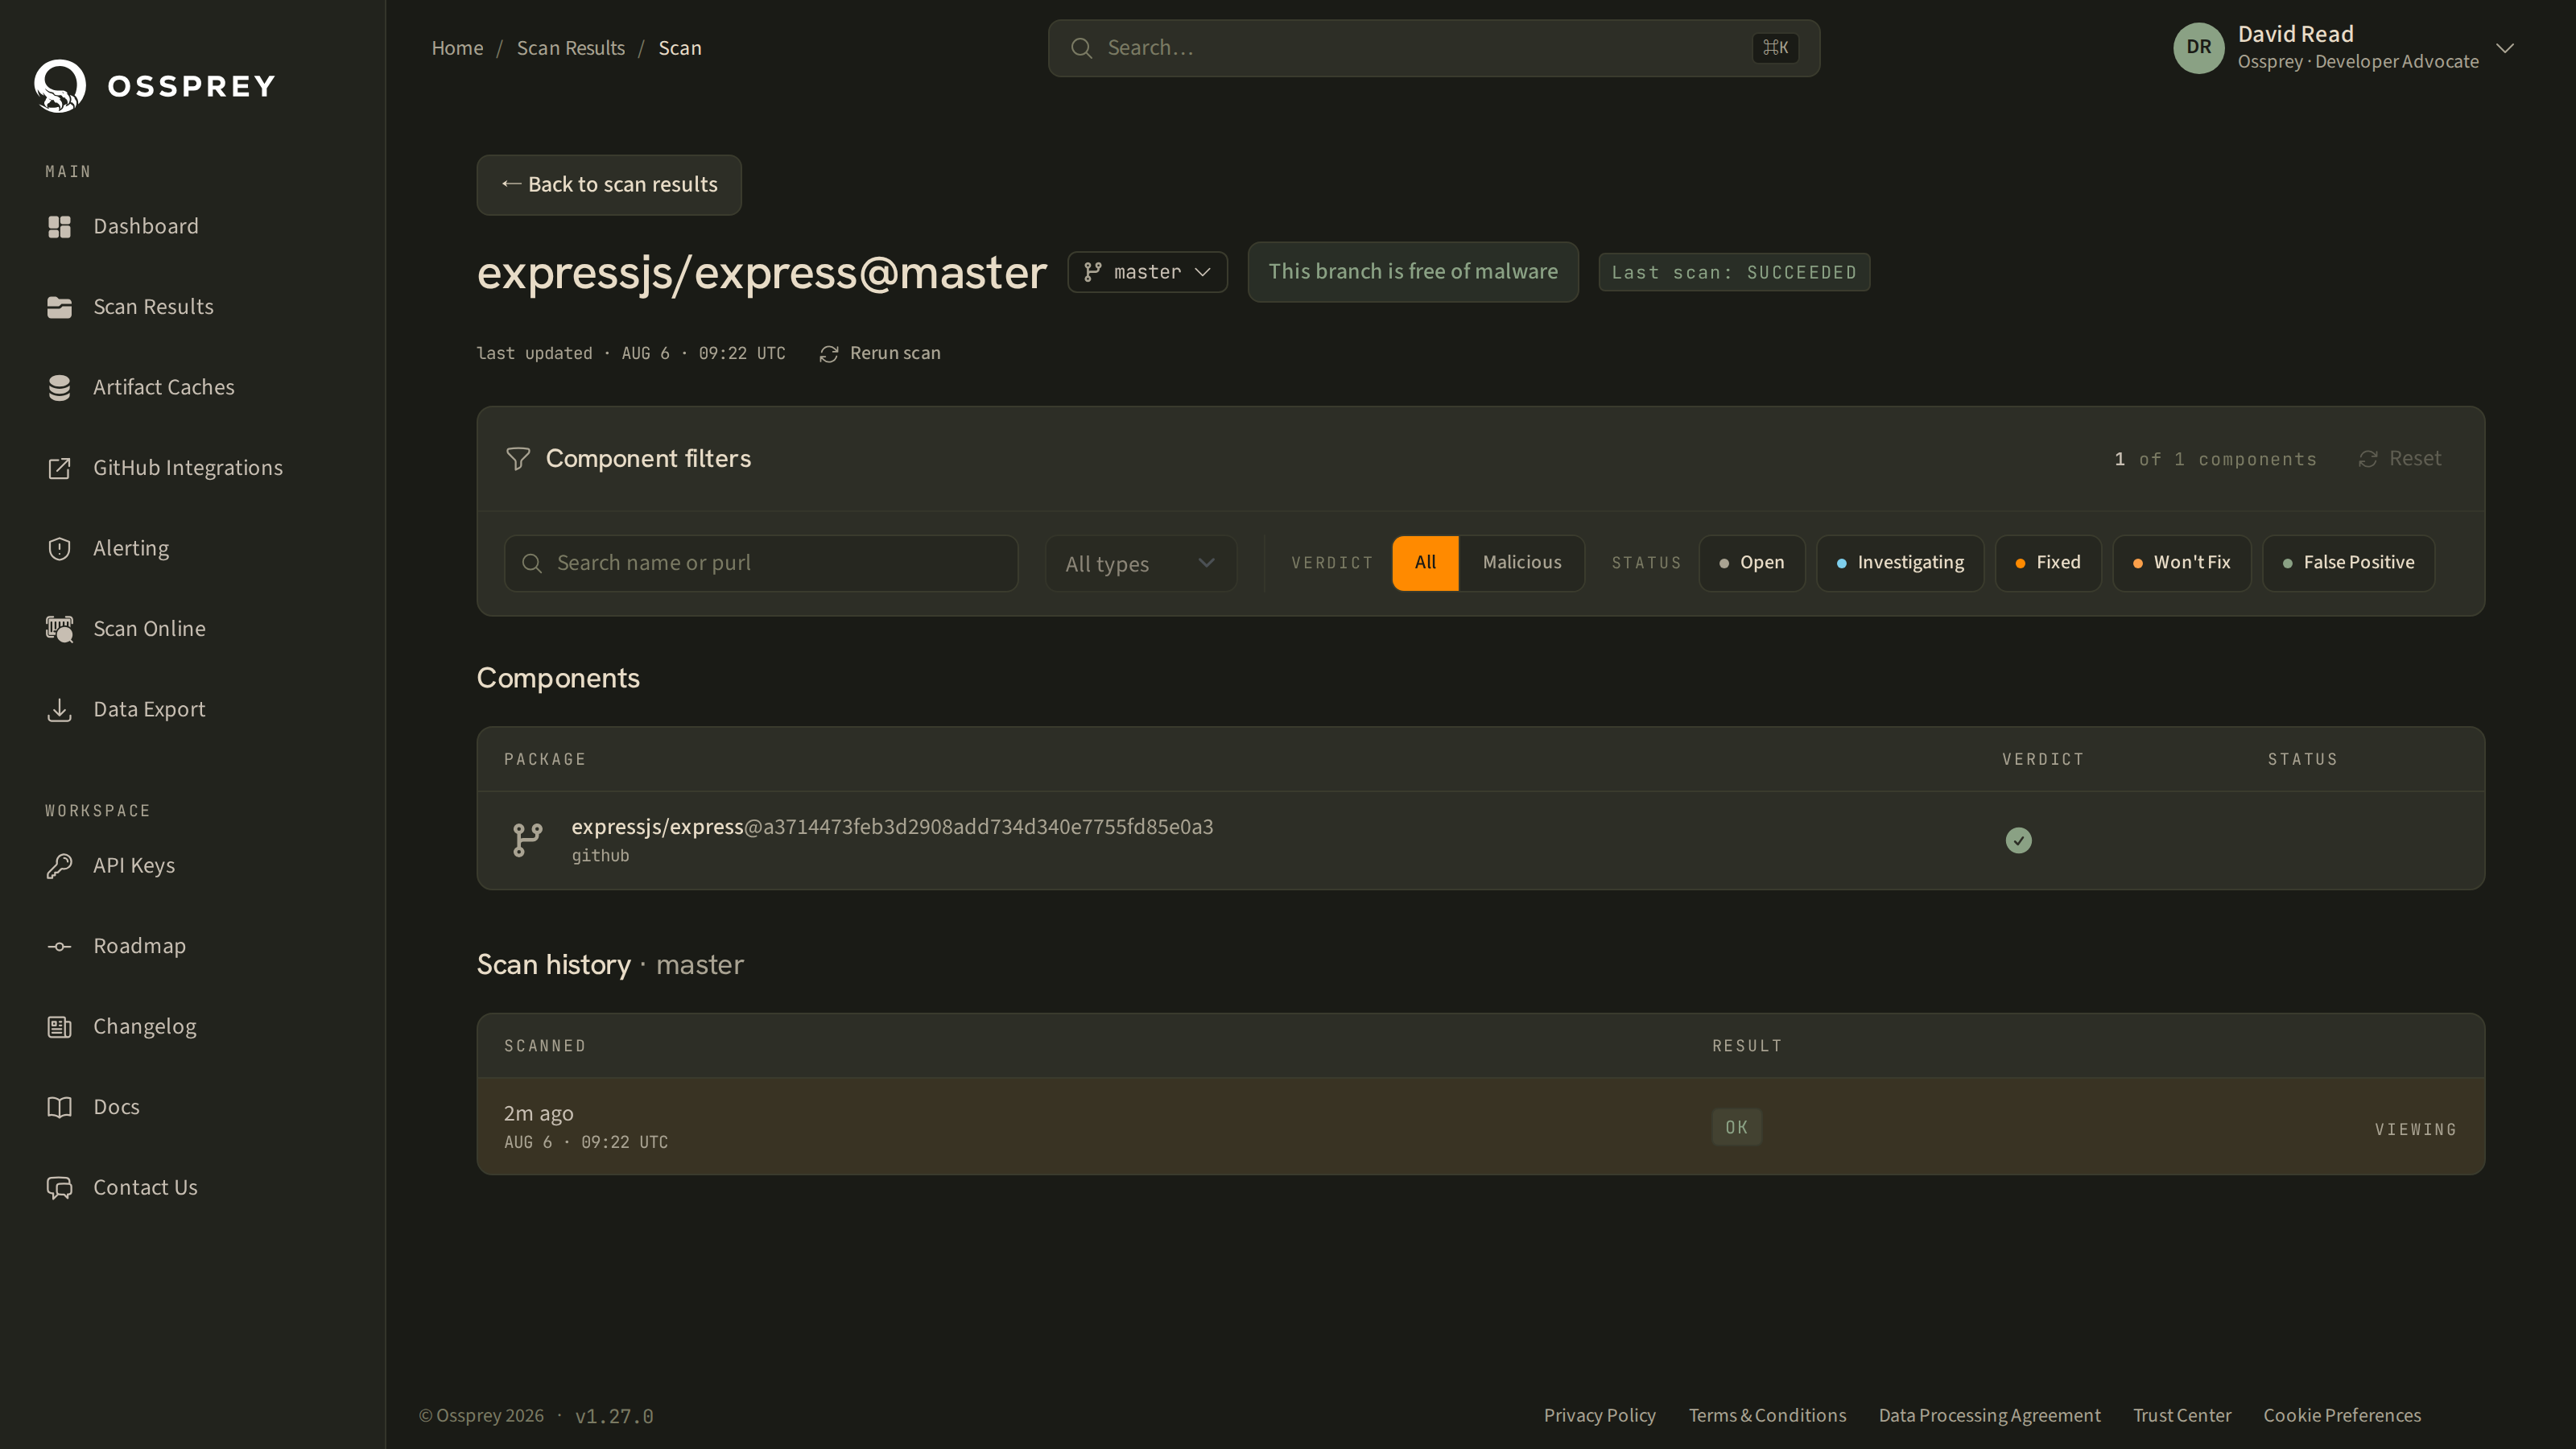
Click any repository to drill into scan details — you'll see the full list of components (dependencies) found, their versions, package types, and finding status. You can filter components by name, package type, and status.
Updated about 1 month ago